Debugging Lovable.dev Apps: Step-by-Step Guide
Master the art of debugging Lovable.dev apps with our step-by-step guide, leveraging advanced tools and community support for effective troubleshooting.
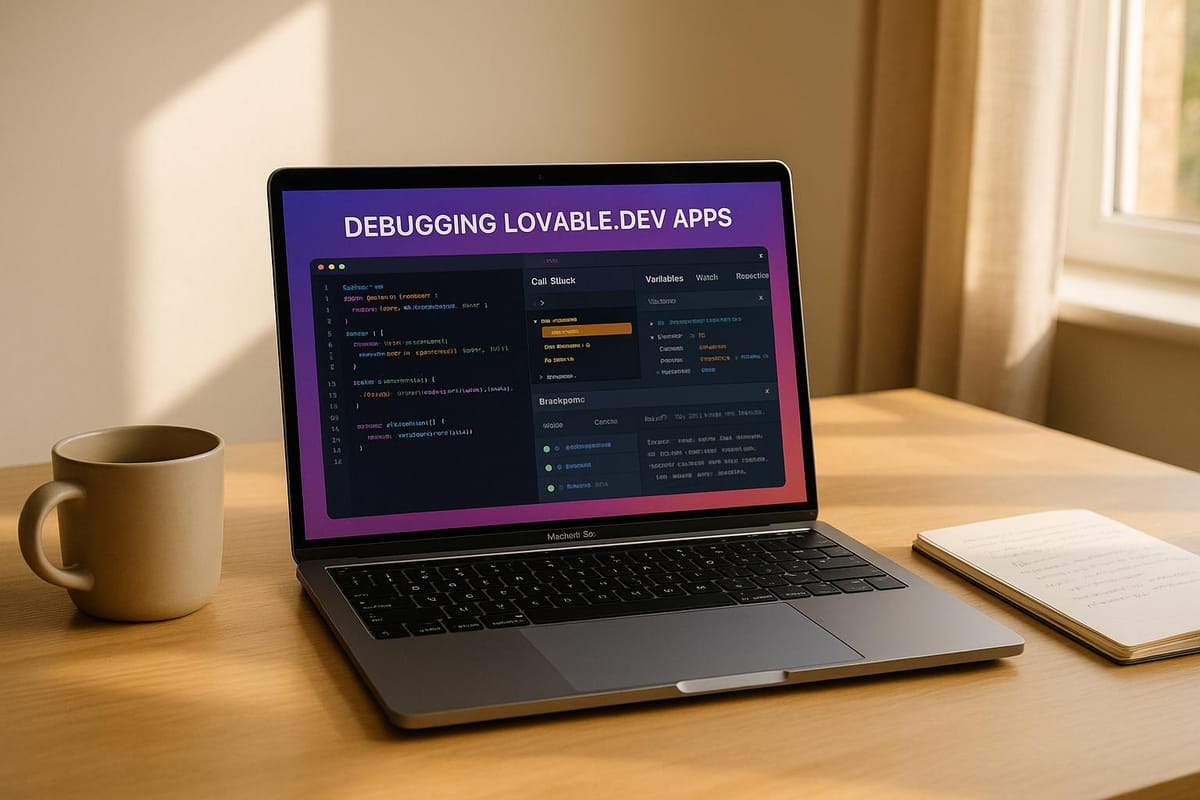
Debugging Lovable.dev apps can feel overwhelming, but with the right tools and approach, you can fix issues faster and improve your app's quality. Here's how:
- Start with the Issue: Clearly define the problem by comparing expected vs. actual behavior. Use error logs and tools like the Visual Inspector to gather insights.
- Leverage Built-In Tools: Use Lovable.dev's AI Debug Assistant, Change Tracker, and Error Console to identify and resolve problems efficiently.
- Fix Common Issues: Address build errors, broken features, and UI glitches systematically. Test across environments and apply fixes incrementally.
- Go Advanced if Needed: Use Lovable.dev's AI-powered code review and community support for persistent bugs.
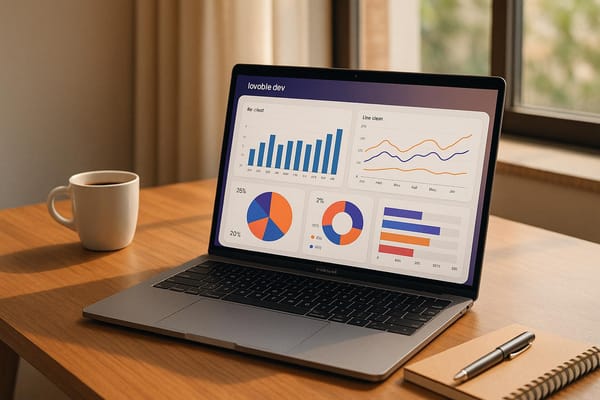
Quick Overview of Tools
| Tool | Purpose | Advantage |
|---|---|---|
| AI Debug Assistant | Real-time error analysis and solutions | Fast troubleshooting |
| Visual Inspector | Debug UI components | Direct interaction with visuals |
| Change Tracker | Track and roll back versions | Safe experimentation |
| Error Console | Logs errors and stack traces | Detailed technical insights |
Debugging isn't just about fixing - it’s about creating better apps. Start with simple steps, use the right tools, and collaborate when needed to make debugging smoother and faster.
Mobile crash reporting and debugging best practices
Step 1: Find and Define the Issue
Start by clearly identifying and describing the problem. A well-defined issue makes troubleshooting much smoother.
Compare Expected and Actual Results
Highlight the differences between what should happen and what is actually happening. Use the following table to organize key details:
| Aspect | Documentation |
|---|---|
| Expected Behavior | Description of how it should work |
| Actual Behavior | Description of the current issue |
| Steps to Reproduce | Precise steps to recreate the problem |
| Environment | App version, browser, device, etc. |
| Impact Level | How severe the issue is |
Providing these details helps the AI Debug Assistant create more precise solutions. Once documented, examine system logs for additional clues.
Check Error Messages and Logs
After defining the issue, review any error messages for actionable insights.
1. Access the Error Console
The Error Console provides essential information such as:
- Type and severity of the error
- Timestamp indicating when the error occurred
- Stack trace showing the sequence of events leading to the issue
2. Interpret Error Messages
Look for common error types in Lovable.dev apps:
- Syntax errors: Often highlighted in red within the code editor
- Runtime errors: Displayed in the console with specific error codes
- Logic errors: May need a comparison of variable values to expected outcomes
3. Use the Visual Inspector
The Visual Inspector is great for pinpointing UI-related issues. It can show:
- The hierarchy of components
- Real-time state changes
- Event triggers and their results
Focus on logs from the reported timestamps to identify patterns or conditions that might be causing the issue. This step ensures you're investigating the root of the problem effectively.
Step 2: Use Built-in Debug Tools
Lovable.dev includes a handy Change Tracker to help you manage your app's version history. Once you've spotted the issue, you can use these built-in tools to figure out what went wrong. The Change Tracker makes it easy to roll back to a stable version after identifying the problematic changes.
Track Changes and Restore
- View detailed change history, complete with timestamps and modification notes.
- Use the integrated diff tool to compare different versions side by side.
- Quickly restore your app to a previous stable version with just a few clicks.
Step 3: Fix Common Problems
Debugging with the Lovable.dev app often means dealing with recurring issues. Here's a systematic approach to tackle them using Lovable.dev's specialized tools.
Solve Build Errors
To address build errors:
- Double-check that your environment variables align with your deployment settings.
- Verify that API endpoints are properly configured and operational.
- Inspect component dependencies for any version mismatches.
- Use the app's built-in error log analyzer to locate specific error sources.
Fix Broken Features
When features stop working, take a structured approach:
- Document the exact steps needed to reproduce the issue.
- Test across different environments to confirm how widespread the problem is.
- Leverage the AI Debug Assistant to review and analyze function calls.
- Apply fixes incrementally to ensure the app remains stable.
For better insights, enable detailed logging for the affected feature to track its execution flow.
Correct UI and Layout Issues
UI and layout glitches can disrupt the user experience. Common problems include:
- Responsive design breakpoints not working as expected.
- Conflicting styles between components.
- Layout shifting during page loads.
- Rendering inconsistencies across different browsers.
Here's how to tackle these issues:
- Identify the Scope: Test on various devices and browsers to understand the problem's extent. Use Lovable.dev's device preview mode to replicate different environments.
- Debug Visual Elements: Turn on visual debug mode to highlight component boundaries and spacing issues, making it easier to spot layout problems.
- Test Performance: Conduct performance tests to uncover hidden UI challenges that might not be immediately visible.
Step 4: Try Advanced Debug Methods
When basic debugging doesn’t solve the problem, Lovable.dev offers advanced tools designed specifically for its apps. These tools combine AI-driven analysis with insights from a developer community to tackle persistent bugs.
Full Code Review
This step takes a deeper dive into your codebase, building on earlier debugging efforts. Lovable.dev's AI-powered code review system examines dependencies, execution flows, and conflicts within your project.
By enabling Context Mode, you can generate visual dependency maps, making it easier to spot problematic interactions between your UI and backend.
Here’s a breakdown of how the AI review process works:
| Phase | Action | Expected Outcome |
|---|---|---|
| Initial Scan | AI evaluates code structure and dependencies | Detects version conflicts and syntax problems |
| Deep Analysis | Reviews component relationships and async patterns | Highlights race conditions and memory leaks |
| Solution Generation | Offers fixes with code examples | Suggests optimized implementations for your code |
For instance, the system can identify issues like outdated API responses in problematic useEffect hooks and recommend cleanup functions to resolve them.
Get Help from Other Developers
If the advanced review doesn’t fix the issue, turning to the developer community can make a big difference. Lovable.dev’s community platform, loveableapps.ai, connects you with thousands of developers who can provide additional insights. Features like live collaboration sessions and Debug-A-Thon events have been particularly effective, with a 92% success rate for resolving issues in Q1 2025.
To get the best results from the community, make sure your help request includes these key details:
- Environment Details: Mention your Lovable.dev version and Node setup.
- Error Context: Share AI-summarized error logs (keep it concise - around three lines).
- Reproduction Steps: Provide clear, step-by-step instructions on how to replicate the issue.
- Visual Evidence: Attach annotated screenshots from the Visual Debugger.
The loveableapps.ai platform has grown significantly, now featuring over 500,000 developers and 450+ pre-debugged UI templates. For example, a recent authentication timeout issue was resolved when community member @DevOpsAlex shared a WebSocket keepalive pattern, reducing timeouts by 94%.
Wrap-up: Key Debug Steps
Debugging in Lovable.dev combines AI tools with a structured approach. Here's a summary of the essential techniques covered earlier.
The debugging process involves four key steps:
-
Define and Analyze the Issue
Start by comparing what you expect to happen with the actual results. Use Visual Debug Tools to carefully review error messages and logs for insights. -
Use the Tools at Hand
Make the most of Lovable.dev's built-in tools. Features like real-time monitoring can quickly identify new problems as they arise. -
Tackle Problems Systematically
Focus on resolving high-priority issues first, especially those that impact multiple components - like UI rendering glitches that affect user experience across the app. -
Document and Plan for the Future
Keep a record of solved issues to spot patterns and develop strategies to prevent them. Using Lovable.dev's tools not only fixes current problems but also helps you create more reliable applications.
FAQs
How can I use Lovable.dev's tools to debug and fix complex issues in my app?
Currently, there isn't specific information about an AI Debug Assistant within Lovable.dev. However, you can effectively troubleshoot issues in your app by leveraging Lovable.dev's robust debugging tools and community resources. Start by reviewing error logs, testing individual app components, and consulting the detailed guides available in the Lovable.dev documentation. For additional support, consider engaging with the Lovable.dev community to share insights and solutions.
What are the best practices for documenting and troubleshooting issues when debugging apps on Lovable.dev?
To effectively debug apps on Lovable.dev, start by clearly documenting the issue. Include details like the steps to reproduce the problem, any error messages, and the expected versus actual behavior. This helps you and others understand the issue more quickly.
When troubleshooting, focus on isolating the problem. Test individual components or workflows to identify where the issue originates. Use Lovable.dev's built-in debugging tools to track errors and logs. Regularly review the platform's documentation and community resources for tips and solutions. Staying organized and thorough in your process can save time and improve your debugging efficiency.
What should I do if I can’t fix a stubborn bug in my Lovable.dev app?
If you're stuck on a persistent bug, the Lovable.dev community platform is a great place to turn for help. You can explore LoveableApps.ai, which offers a variety of resources like tutorials, guides, and best practices tailored for Lovable.dev builders. It also connects you with other developers and creators who might have insights into solving your issue.
Don’t hesitate to leverage the community’s collective knowledge - whether it’s troubleshooting tips, debugging techniques, or learning from similar projects, you’re not alone in solving tricky problems!